
Admin Area Dashboard
Detailed overview for monitoring your business health and activity
Quick stats overview
The main dashboard shows key metrics to quickly check your business performance. These stats can be sorted by currency and cover both all-time totals and recent activity within chosen date ranges.
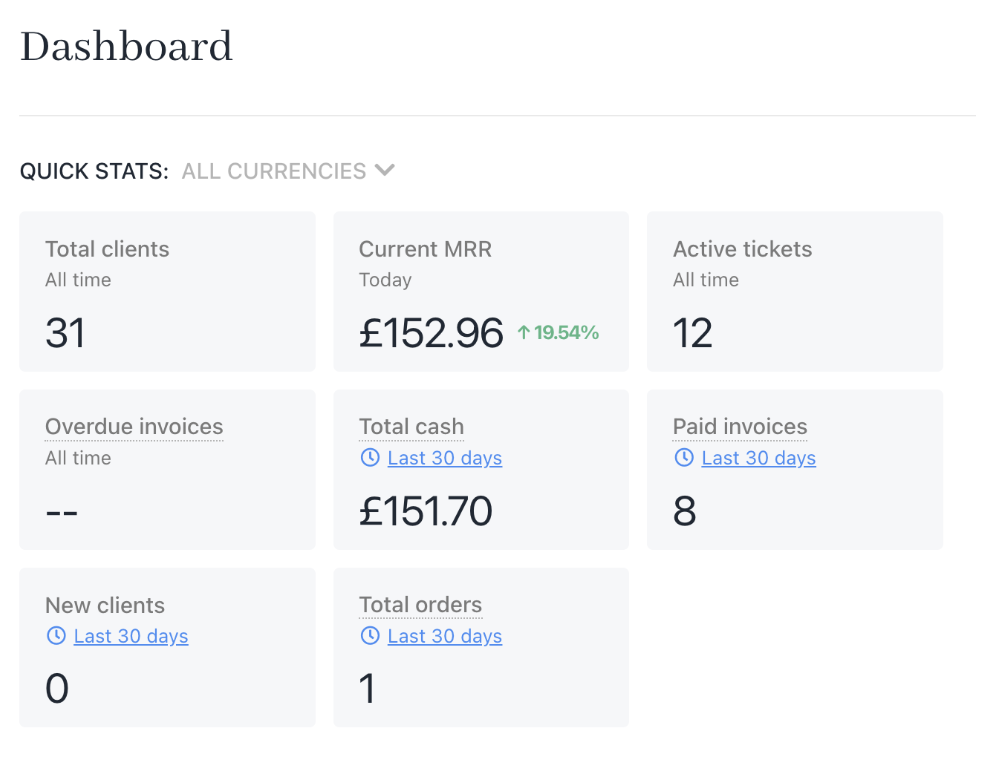
Quick stats
- Total Clients (All Time): Displays the total number of clients registered in Upmind. This tracks your overall customer growth since the beginning.
- Current MRR (Today): Monthly Recurring Revenue (MRR) reflects the total subscription revenue expected for the current month as of today. It gives a quick view of financial health and recurring income trends.
- Active Tickets (All Time): Counts all support tickets currently open. Monitoring active tickets allows you to understand ongoing client issues and helps manage workload.
- Overdue Invoices (All Time): Shows the number of invoices past their due date and unpaid. This helps identify outstanding payments to be addressed quickly.
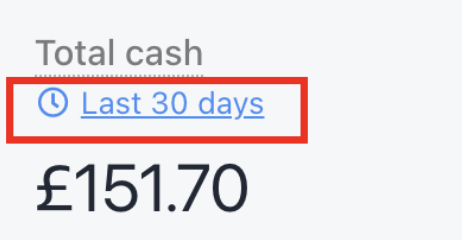
- Total Cash (Last 30 Days): Indicates total cash collected in the chosen currency during the last 30 days, adjustable by calendar. Useful for tracking recent income and revenue trends.
- Paid Invoices (Last 30 Days): Counts invoices fully paid within the selected period. This indicates payment collection effectiveness.
- New Clients (Last 30 Days): Shows how many new clients were added within the last 30 days. It indicates growth rate and acquisition success.
- Total Orders (Last 30 Days): Counts all orders placed in the chosen date range. Useful for tracking sales volume.
You can adjust the date range of certain stats to find particular values.
Click to select range
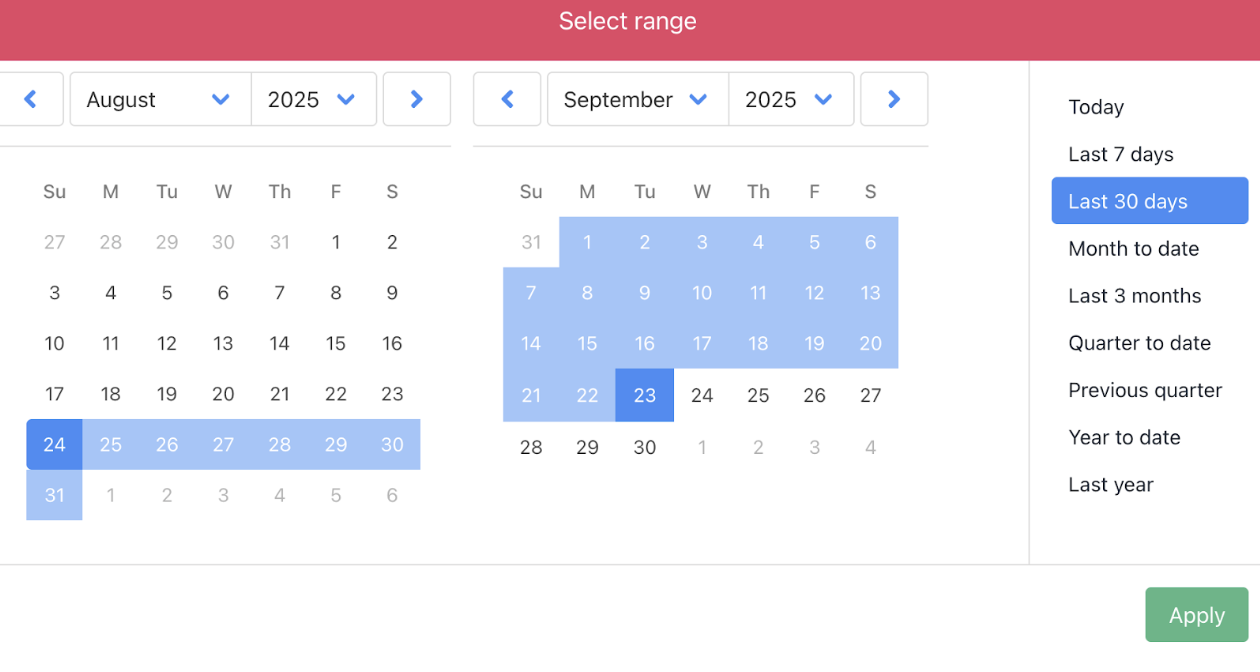
Select range
Orders graph
A visual line chart showing the number of orders on the vertical axis, plotted against dates on the horizontal axis, within the set calendar range.
The graph visualises orders by value of the currency selected. This graphical overview provides quick insight into sales trends.
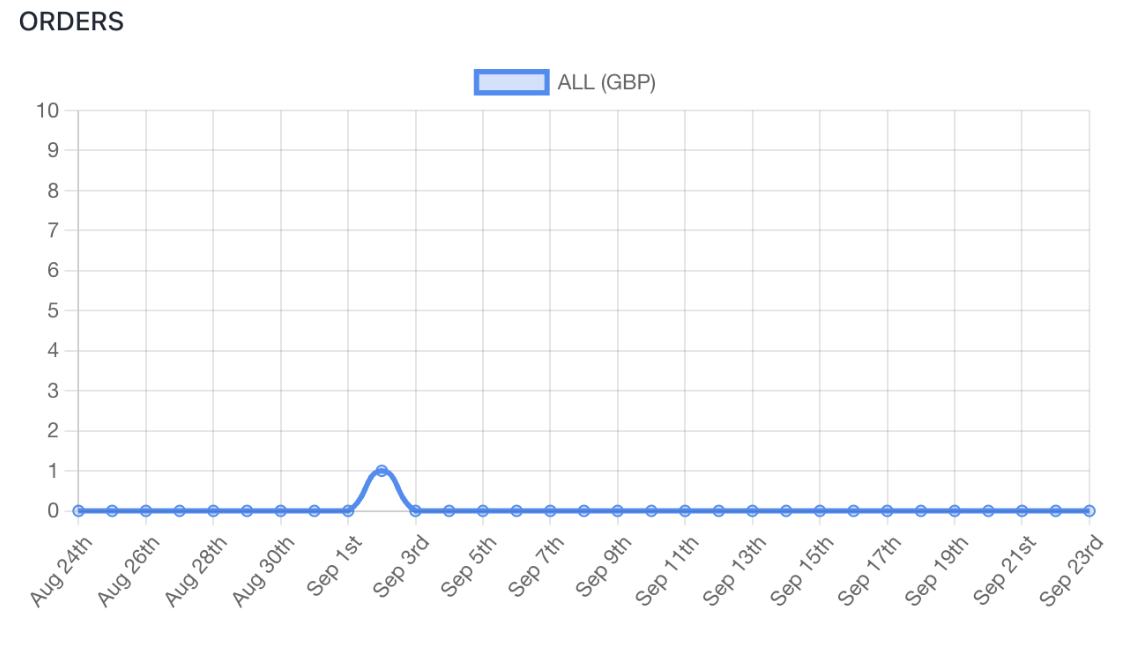
Orders graph
Invoice graph
A line chart visualising invoice amounts (vertical axis) over time (horizontal axis). Users can adjust the date range using the calendar, and the value is given according to the chosen currency. This helps spot billing peaks, seasonal trends, or irregularities in invoice issuance.
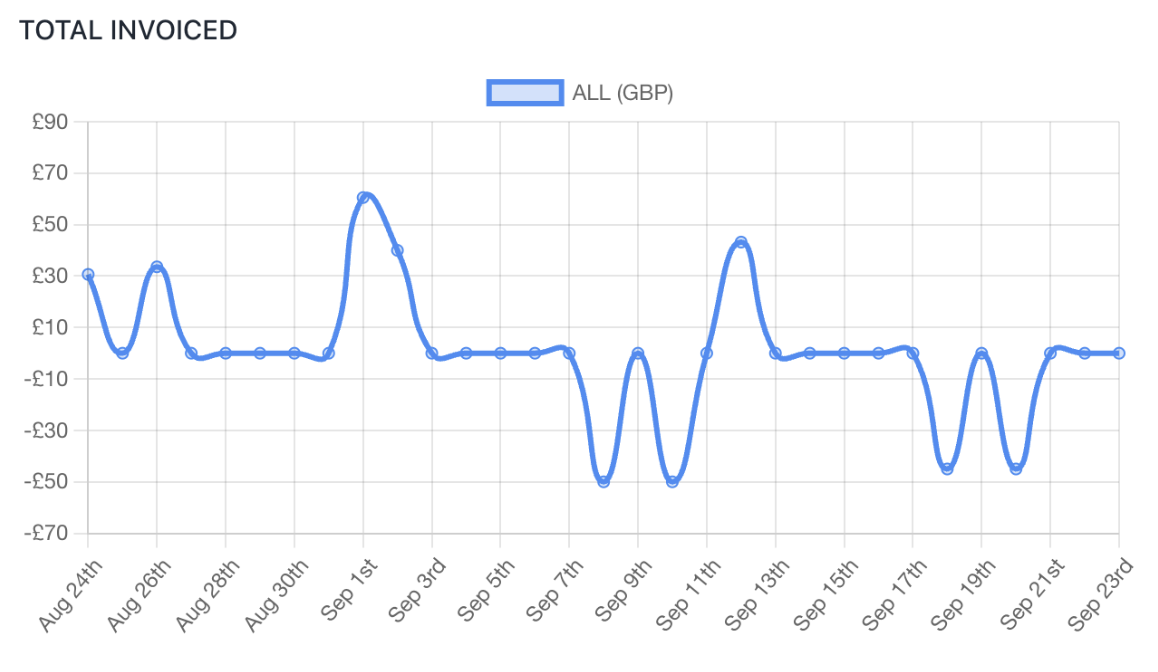
Invoice graph
Activity stream
The activity displays recent events on the Upmind platform, showing system and user actions in order. Users can click on items to view the full activity log with detailed raw event data.
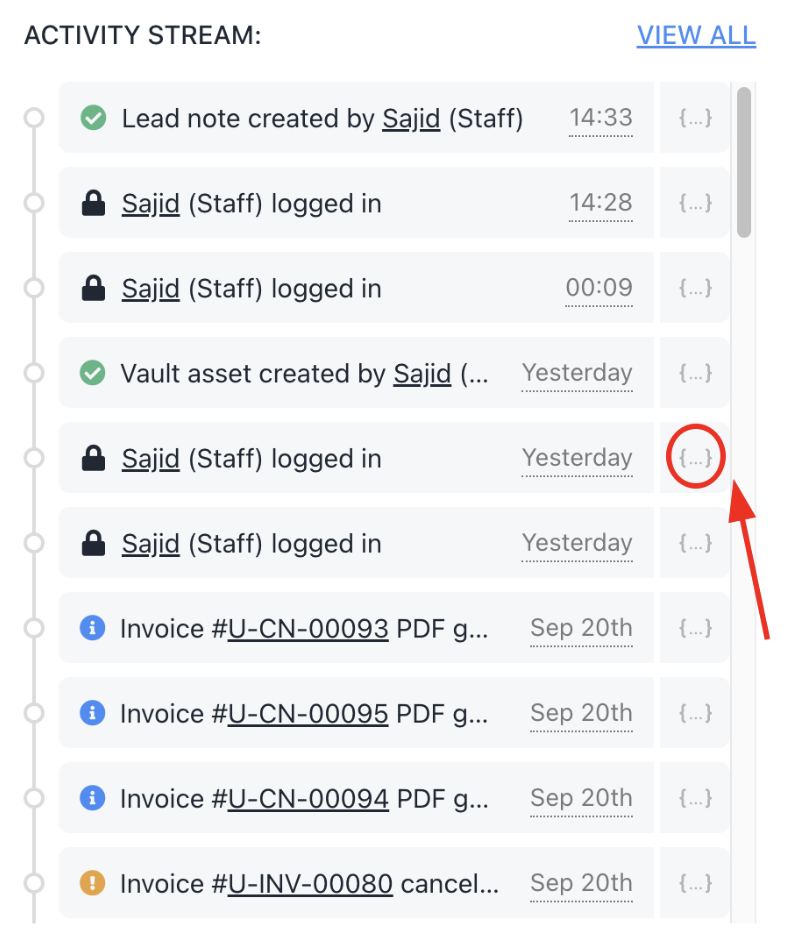
Activity stream
Some of the common activity events logged:
- Staff login/logout
- Invoice generated
- Invoice cancelled
- Transaction created or updated
- Payment reverted or refunded
- Subscription created, renewed, or cancelled
- Contract product activated, suspended, or terminated
- Retention status changed
- Customer added or updated
- Support ticket opened, replied, closed, or assigned
- Price or discount updates on products
- Import or export actions executed
- Domain purchase or transfer initiated
- Promo codes created or applied
- Staff or admin account created/ updated/ deleted
- Brand settings modified
- API token created, updated, or revoked
- Email template created or modified
- Automated workflows triggered
- Refunds processed
- Credit added or redeemed
Activity log details:
- Event description
- Date and time
- Actor (system, staff user with email)
- Email correspondence history linked to event, filterable by subject and date
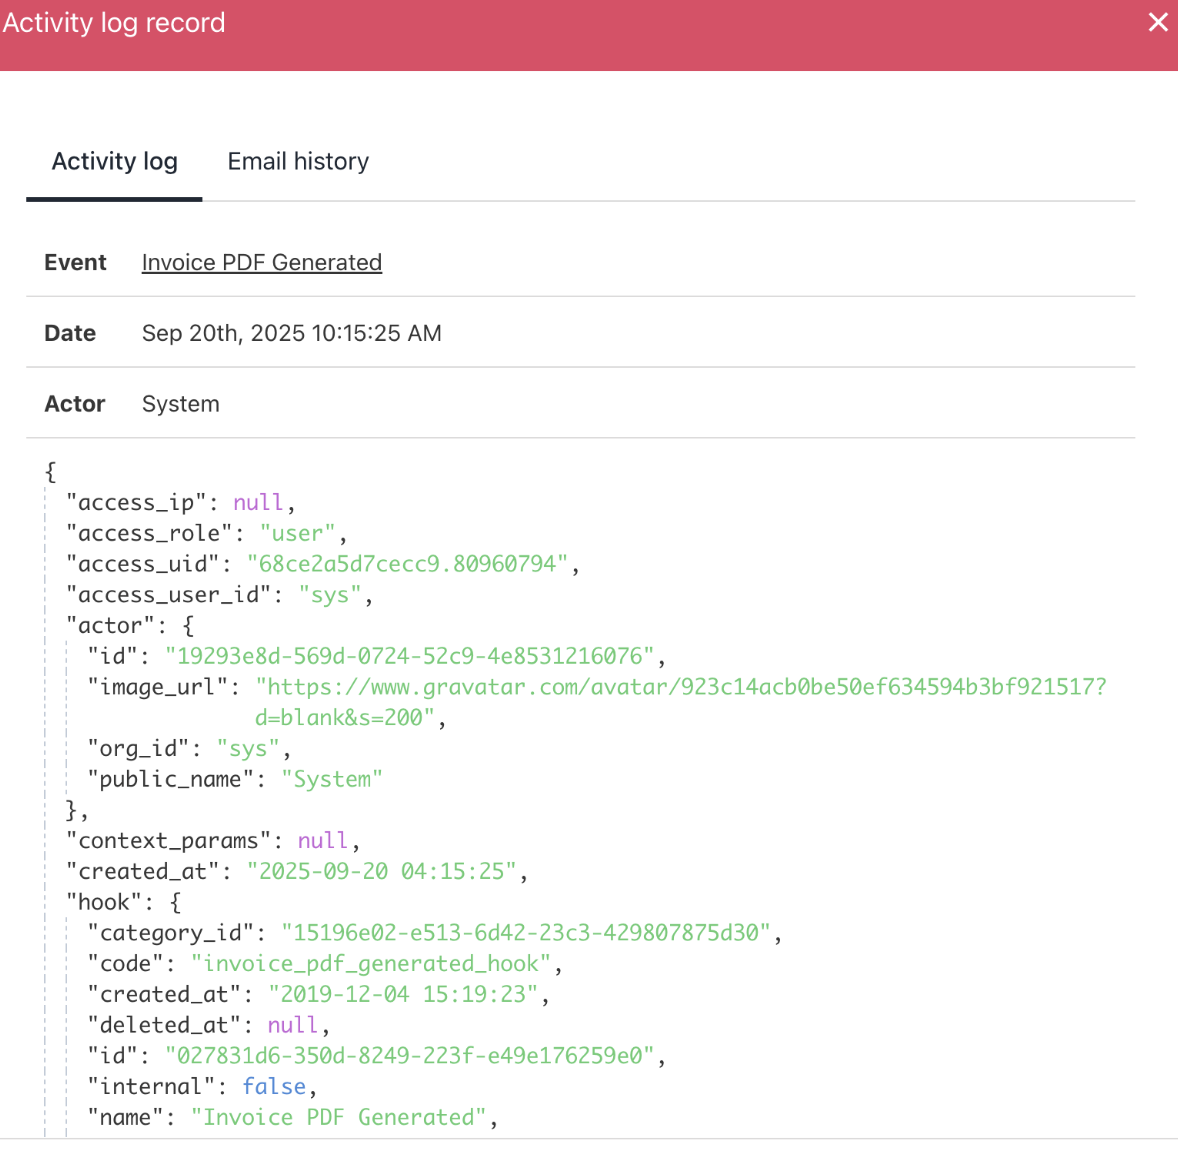
Activity log record