
Available data types
The reporting system includes core datasets such as:- Accounting Data: Invoices issued, credit notes, outstanding balances.
- Tax Information: Sales tax collected.
- Transactional Data: Money received and paid out.
- Revenue Reports: Monthly run rate (MRR) and subscription revenue trends.
- Business Performance Metrics: Churn rates, customer lifetime revenue (LTR), average revenue per user (ARPU).
- Operational Metrics: Customer acquisition and retention statistics.
Accessing performance data
- Log in to your Upmind account.
- Select Insights and Reports from the left navigation panel.
Monthly Report page showing key revenue and performance data.
Selecting and customising a data set
Use the left menu to switch between different datasets and reports.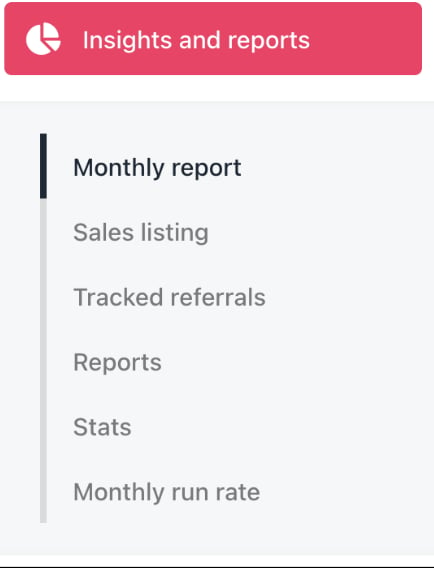
Insights and Reports section, table data can be customised by adjusting column types, order, and width, but this option is only available on the Sales Listing and Tracked Referral pages.
Add or remove columns
- Click the Manage Columns icon.
- Check or uncheck the boxes for the columns you want to show or hide.
- Click Save.

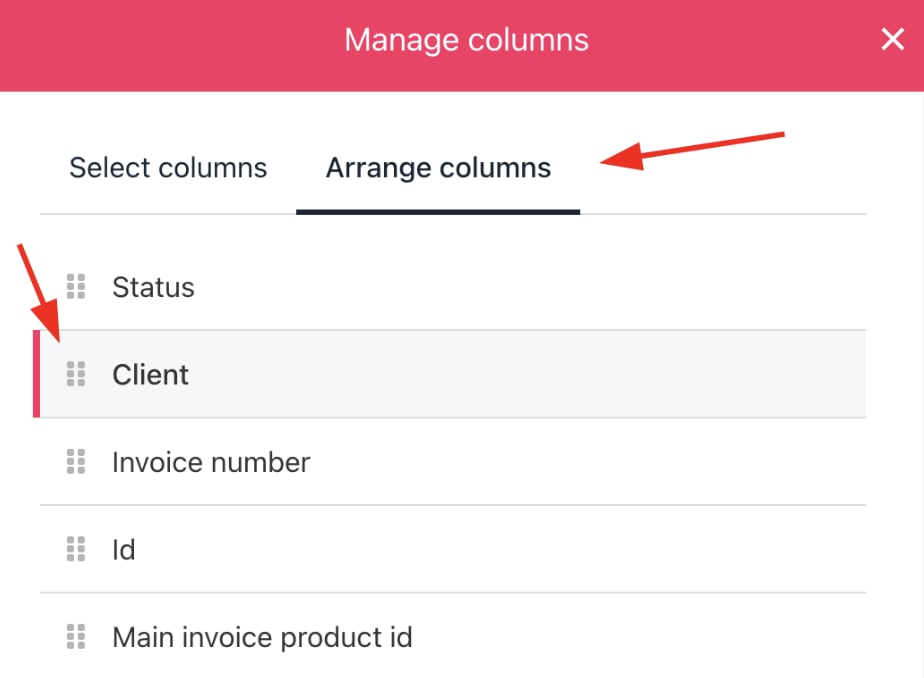
Reorder columns
- Click the Manage Columns icon.
-
Go to the
Arrange Columnstab. - Drag and drop column names to rearrange.
- Click Save.
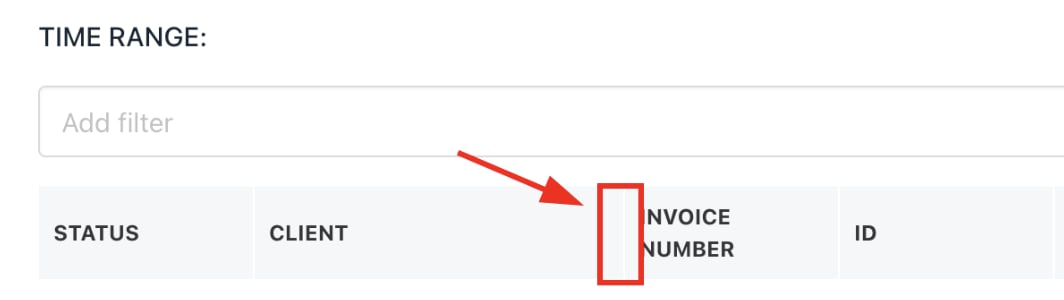
Change column width
- Hover over a column border next to the heading.
- Drag the border left or right to resize.
Filtering sales data
Use filters to narrow the data display:- Click the sort field.
- Select a category.
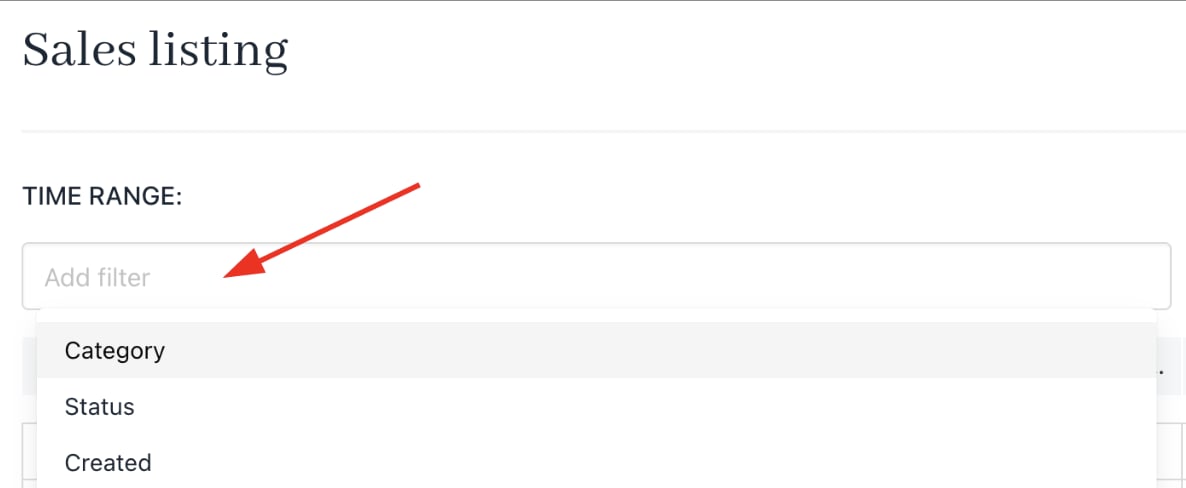
- Choose a condition and enter a value.
- Click Apply.
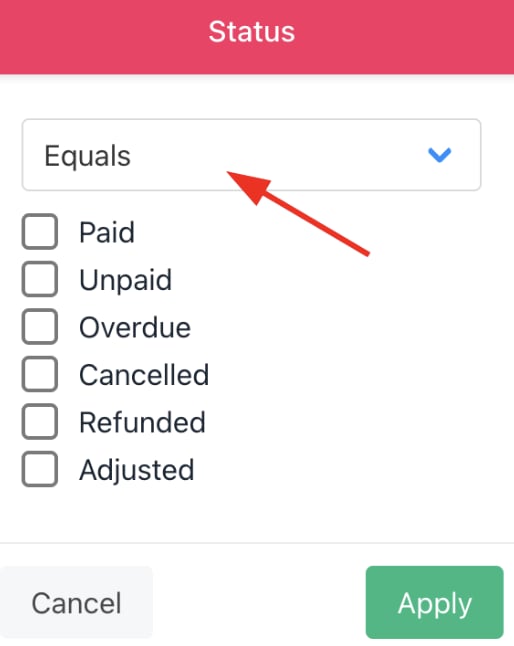
Conditions and values vary by category.
Tracking referrals
Click Tracked Referrals in the left menu to see all referred clients and orders brought by advocates.
Review stats
Click Stats in the left menu to view cash, invoice, and client data for the last 30 days by default. To change the time frame:- Click the Last 30 days link.
- Select or highlight a new period.
- Click Apply.
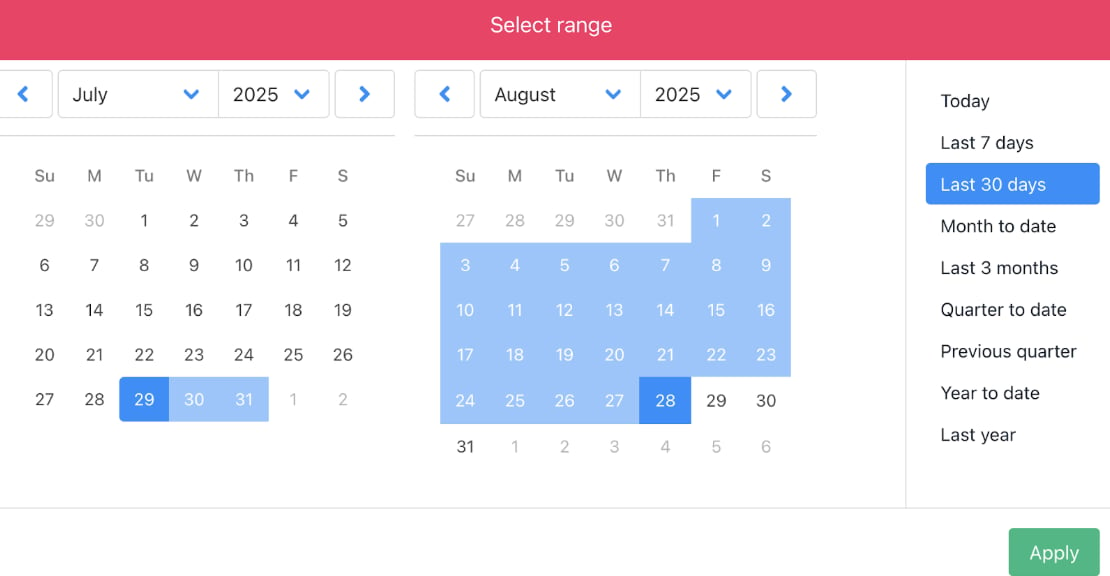
The selected time frame applies to all metrics on this page.
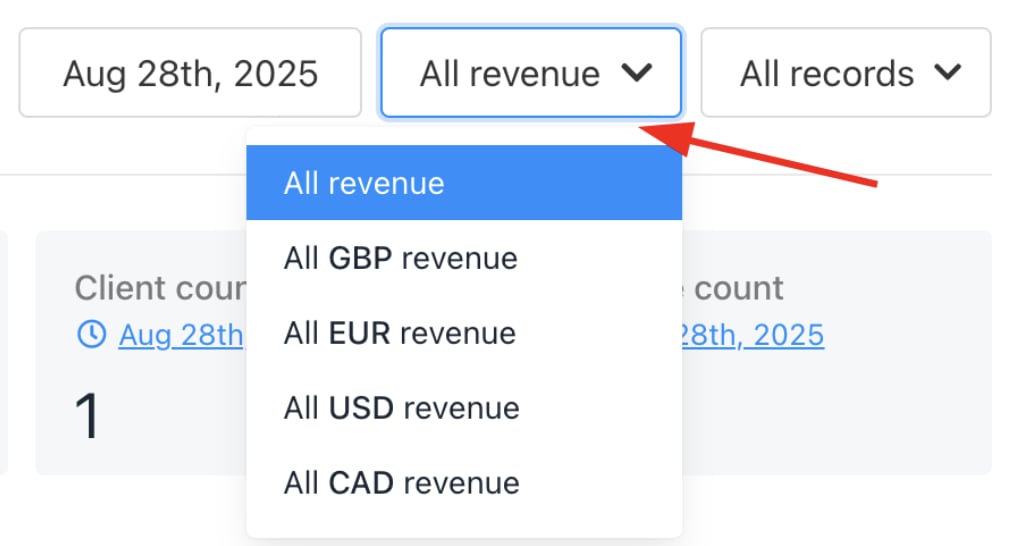
Reviewing MRR data
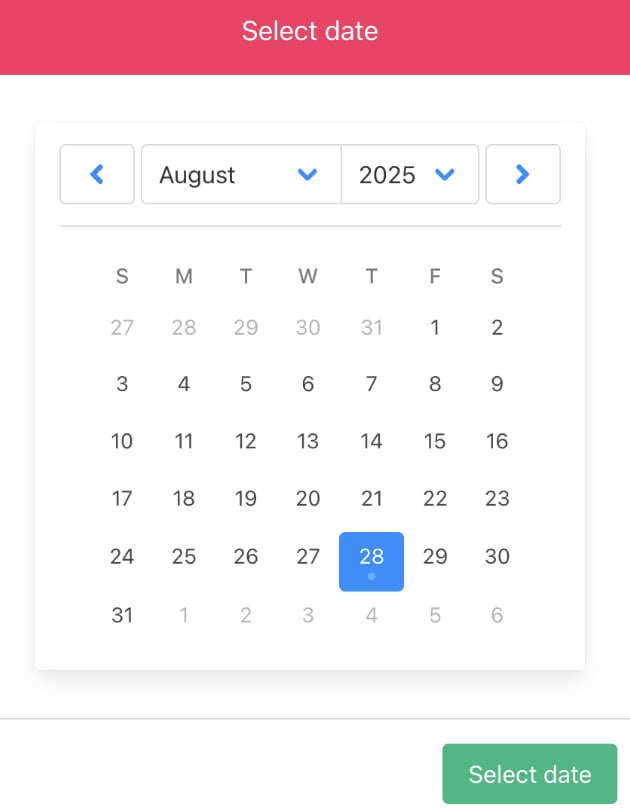
Click Monthly Run Rate in the left menu to view actual and projected subscription revenue across currencies. To change the start date:- Click the date link.
- Pick a date from the calendar.
- Click Select Date.
- Click the All Revenue button top right.
- Select your home currency.
Accessing reports
You can access all the various report types from Insights and Reports > Reports.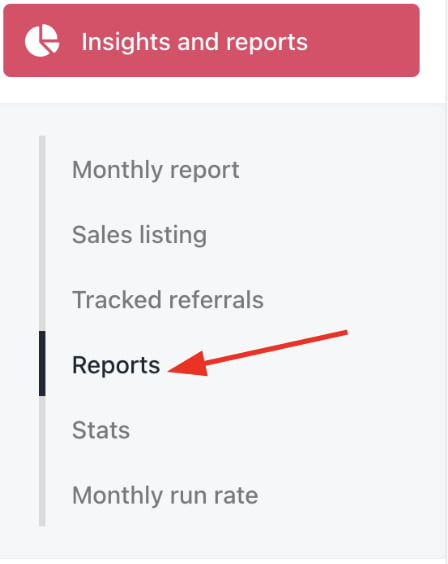
Regenerating reports
Once you generate a report, you can regenerate it by clicking the three dots.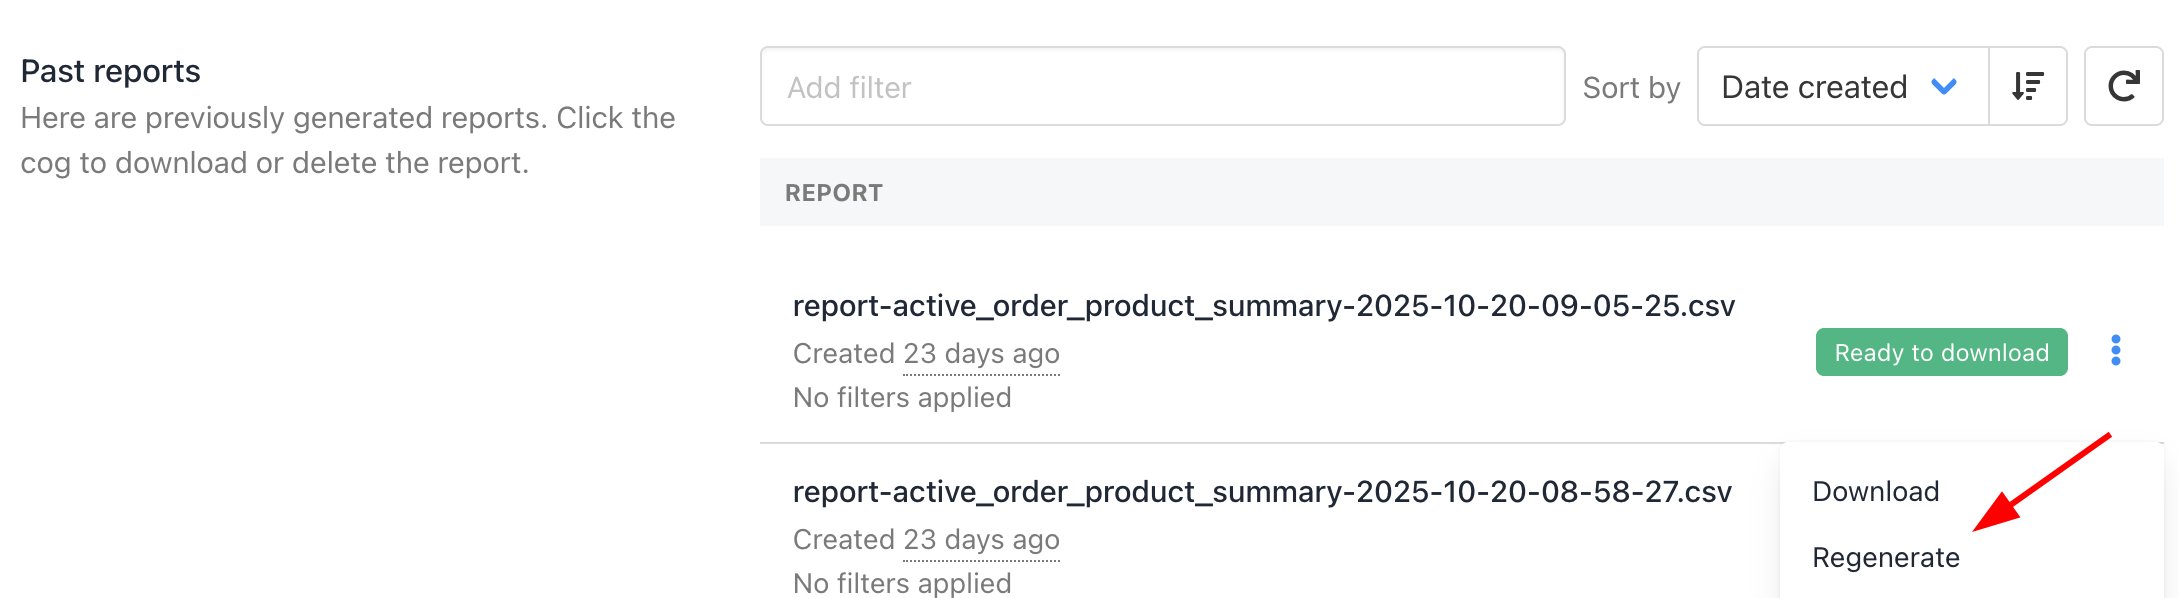
Available report types
This section describes the available report types in Upmind and highlights report names, descriptions, and the key data each report provides.| Report Name | Description | Data Provided |
|---|---|---|
| Active Order Product Summary | Summarises current active orders by product. | - Product details (product ID, brand ID, product name, category name, provision category, provision provider) - Active order counts - Report code - Catalogue URL |
| Orders By Product | Lists orders grouped by product. | - Product details (product category, name) - Order count - Revenue - Order amount (Tax amount, net amount) - Formatted amounts (Tax amount, net amount) |
| Orders By Product Bc | Similar to Orders By Product but with brand currency conversion. | - Product details (product category, name) - Billing cycle - Order count - Revenue - Order amount (Tax amount, net amount) - Formatted amounts (Tax amount, net amount) |
| Orders By Promotion | Shows orders by applied promotions. | - Promotion details (promotion name, codes) - Product details (contract product ID, product service identifier) - Order details (net selling price, quantity, net amount) - Client details (client ID, name, email) - Invoice details (invoice name, type) - Billing cycle |
| Orders By Product Category | Aggregates orders by product category. | - Product details (product categories, count) - Revenue (net amount, tax amount, total amount, total quantity) - Average net selling price - Formatted amounts (net amount, tax amount, total amount, total quantity) |
| Tracked Referrals By Client | Referrals sourced per client. | - Client details (client name, email, country) - Payment details (payment detail gateway, medium, source) - Referrals (Campaign, content, term, create datetime) |
| Tracked Referrals By Order | Referral data grouped by order. | - Service details (service status summary, service active days summary) - Order details (order status, order number, order summary) - Product name - Client details (client name, email, country) - Payment details (gateway, medium, source) - Billing cycle months - Cancellation date - Currency code - Order amount (initial amount, amount by client, paid amount, amount migration, amount renew, credit notes) - Formatted amounts (initial amount, amount by client, paid amount, amount migration, amount renew, credit notes) - Referrals (Campaign, content, term, create datetime) |
| All Clients And Leads | Comprehensive client and lead list. | - Client and lead identifiers (email, phone number, client name) - Company details (company name, type, reg date, verification) |
| Active Inactive Clients | Status report on active versus inactive clients. | - Client and lead identifiers (email, phone number, client name) - Company details (company name, type, reg date, verification, status) |
| Cash In Per Day | Daily cash inflow report. | - Payment details (payment date per day, gateway) - Transaction details (count of transactions, currency code, money in and out, brand currency, total result) - Formatted amounts (money in and out, brand currency, total result) |
| Cash In Per Month | Monthly cash inflow summary. | - Payment details (payment date per month, gateway) - Transaction details (count of transactions, currency code, money in and out, brand currency, total result) - Formatted amounts (money in and out, brand currency, total result) |
| Tickets Per User | Support tickets count by user. | - User details (from date, to date, user name) - Ticket details (ticket count, ticket replies, clients by ticket count, leads by ticket count) |
| Tickets Per Client | Ticket volume per client. | - Client details (from date, to date, client name) - Ticket details (ticket count, ticket replies) |
| Tickets Per Lead | Tickets associated with leads. | - Lead details (from date, to date, lead name) - Ticket details (ticket count, ticket replies) |
| Invoice Items Taxes Detailed | Detailed tax breakdown per invoice item. | - Invoice details (date, number, invoice status, invoice category) - Tax details (tax country, invoice tax amount, tax tag, tax rate) - Formatted amounts (invoice tax amount formatted) |
| All Taxes By Tag And Country | Tax reports filtered by tags and country. | - Tax details (tax country, invoice tax amount, tax tag, tax rate) - Formatted amounts (invoice tax amount formatted) |
| All Invoices | Complete invoice list. | - Invoice details (date, category, invoice number) - Order amounts (net amount, tax amount, gross amount) - Formatted amounts (net amount formatted, tax amount formatted, gross amount formatted) |
| All Invoices By Country | Invoices grouped by client country. | - Invoice details (country, invoice total amount) - Formatted amounts (invoice total amount formatted) |
| All Invoices GST | GST-specific invoice summary. | - Invoice details (number, client, state, status, create datetime, paid datetime) - GST details (GSTIN, subtotal, total) |
| All Invoices By Category Per Month | Monthly invoices broken down by category. | - Invoice details (date, category) - Order amounts (net amount, tax amount, gross amount) - Formatted amounts (net amount formatted, tax amount formatted, gross amount formatted) |
| Invoices Accrual By Category | Revenue accrual summaries by category. | - Revenue data (monthly revenue) - Invoice details (clients count, services count, category) - Formatted amounts (monthly revenue formatted) |
| Invoices Accrual By Product | Revenue accrual summaries by product. | - Revenue data (monthly revenue) - Invoice details (clients count, services count, product) - Formatted amounts (monthly revenue formatted) |
| Invoices Accrual | Overall revenue accrual reporting. | - Revenue data (number, monthly revenue, invoice item net amount, period days, recognized revenue, deferred revenue, net selling price) - Invoice details (order date, item period from, item period to, item name, product name, category) - Formatted amounts (monthly revenue formatted, invoice item net amount formatted, recognized revenue formatted, deferred revenue formatted, net selling price formatted) |
| Invoices Accrual Paid Unpaid | Accrual reports split by payment status. | - Revenue data (number, monthly revenue, status paid datetime, invoice item net amount, period days, recognized revenue, deferred revenue, net selling price) - Invoice details (order date, item period from, item period to, item name, product name, category) - Formatted amounts (monthly revenue formatted, invoice item net amount formatted, recognized revenue formatted, deferred revenue formatted, net selling price formatted) |
| LTV Churn Arpu By Product | Customer value and churn metrics by product. | - Product details (product name, start of the period clients, end of the period clients) - Monthly LTV details (monthly ARPU, monthly churn rate, monthly LTV) - Interval LTV details (interval ARPU, interval churn rate, interval LTV) - Annual LTV details (annual ARPU, annual churn rate, annual LTV) |
| All Clients And Services | List of clients with associated services. | - Client details (import, status, firstname, lastname, email, client reg date) - Service details (service identifier, description, product name) - Order amounts (currency code, net amount, tax amount, total amount) - Formatted amounts (net amount formatted, tax amount formatted, total amount formatted) - Invoice details (activation date, next invoice date, next due date, suspended date, cancelled date, closed date) |
| Clients By Country | Client distribution by country. | - Client details (client country, count clients, all services, active services) |
| Clients Churn Per Month | Monthly client churn statistics. | - Churn timeline (year month format, client count, date) |
| Affiliates | Affiliate program reporting. | - Affiliate details (email, firstname, lastname, ref count, link count, sales value) - Formatted amounts (sales value formatted) |
| Promotion Usage | Usage statistics for promotional campaigns. | - Promotion details (name code, initial orders, recurring orders) |
| Top Spenders | Lists clients with the highest spending. | - Client details (firstname, lastname, email, client country, postcode, address, phone, company, first order, total spend) - Formatted amount (total spend formatted) |
| Orders Per Payment Method | Shows orders segmented by payment method. | - Payment details (gateways) - Order details (total count, total amount, initial count, initial amount, migration count, migration amount, recurring count, recurring amount) - Formatted amounts (total amount formatted, initial amount formatted, migration amount formatted, recurring amount formatted) |
| Average Ticket Response Times | Measures average response time for support tickets. | - Ticket details (department, first response time minutes) |
| All Invoice Items | Detailed list of all invoice line items. | - Invoice details (invoice number, create datetime, cancellation datetime, paid datetime, status, invoice type, invoice item description, product name, product category, document currency, currency exchange rate, net selling price, credited invoice, credit note invoice) - Amounts (quantity, net amount, tax amount, total amount, net global discount amount, net product discount amount, invoice net amount, invoice tax amount, invoice total amount, invoice paid amount) - Document currency (net selling price document currency, net amount document currency tax, amount document currency, total amount document currency, net global discount amount document currency, net product discount amount document currency, invoice net amount document currency, invoice tax amount document currency, invoice total amount document currency, invoice paid amount document currency) |
| Affiliates Referrals Invoices | Reports on affiliate-driven invoice activity. | - Affiliate details (aff name, aff email) - Referral details (ref name, ref email) - Invoice details (invoice number, create datetime, total amount, paid amount, currency, currency exchange rate, client total amount, client paid amount, status code, invoice type, paid datetime, cancellation datetime) |
| Leads Export Only | Export of lead information only. | - Lead details (ID, name, email, international phone, client ID, comment) - Lead status (assigned client at, created at, updated at, deleted at) |
| Clients Export Only | Export full client details. | - Client details (client ID, import ID, firstname, lastname, email, location source, location town, location country code, location IP, language code, last login) - Client status (is guest, created at, updated at, deleted at, external ID) |
| Clients Addresses Export Only | Export of client address information. | - Client details (ID, import ID, client ID, default, name) - Client address details (address 1, address 2, region, country, city, postcode) - Client status (created at, updated at, deleted at) |
| Clients Emails Export Only | Export of client email contacts. | - Client details (ID, import ID, client ID, email, default) - Client email details (bounced) - Client status (bounced at, created at, updated at, deleted at) |
| Clients Phones Export Only | Export of client phone records. | - Client details (ID, import ID, client ID, default) - Client phone details (international phone) - Client status (created at, updated at, deleted at) |
| Clients Payment Details Export Only | Export of client payment methods and details. | - Client details (ID, import ID, client ID, name, address ID) - Client payment details (card type, gateway ID, auto payment) - Client status (created at, updated at) |
| Clients Companies Export Only | Export of company records linked to clients. | - Client details (ID, import ID, client ID, name) - Company details (VAT number, reg number, email ID, address ID, phone ID) - Status (created at, updated at, deleted at) |
| Gateways Export Only | Export payment gateway configurations. | - Gateway details (ID, import ID, name, provider) - Status (created at, updated at, deleted at) |
| Imports Export Only | Export details of imported data. | - Import details (ID, source code, name) - Status (started at, completed at, created at, updated at, deleted at) |
| Invoices Items Export Only | Export of invoice item details for detailed revenue and billing analysis. | - Invoice details (client ID, gateway ID, payment details ID, address ID, company ID, import ID, ID, number, create datetime, cancellation datetime, paid datetime, due date, next charge date, payment failed attempts, payment currency code, payment currency exchange rate, status, invoice type, invoice item description, product, product category, document currency code, currency exchange rate, invoice product ID, from date, to date, net selling price, quantity, billing cycle months, credited invoice, credit note invoices, contract ID, contract product ID, product code 1, product code 2, main invoice product ID, base price, base price currency, base price exchange rate) - Amounts (net amount, tax amount, total amount, net global discount amount, net product discount amount, invoice net amount, invoice tax amount, invoice total amount, invoice paid amount, invoice partial credited amount) - Status (created at, updated at, deleted at) |
| Baskets Items Export Only | Export of shopping basket and cart details. | - Cart details (client ID, gateway ID, payment details ID, address ID, company ID, import ID, ID, create datetime, cancellation datetime, paid datetime, due date, next charge date, payment failed attempts, payment currency code, payment currency exchange rate, status, invoice type, invoice item description, product, product category, document currency code, currency exchange rate, net selling price, quantity, billing cycle months) - Amounts (net amount, tax amount, total amount, net global discount amount, net product discount amount, invoice net amount, invoice tax amount, invoice total amount, invoice paid amount) - Status (created at, updated at, deleted at) |
| Payments Export Only | Export of payment transaction details. | - Payment details (ID, import ID, client ID, currency code, transaction type, payment amount, currency exchange rate, invoice ID, transaction ID, gateway ID, affiliate payout) - Status (created at, updated at) - Amounts (original client amount) |
| Contracts Products Export Only | Export of active contract products. | - Contract details (contract ID, import ID, client ID, company ID, payment details ID, address ID, gateway ID, contract product ID, product, product category, service identifier, description, net selling price, base price, base price currency code, currency code, currency exchange rate, quantity, billing cycle months, status, next invoice date, next due date, activation date, suspended date, cancelled date, closed date, calculated suspend date, calculated cancel date, calculated close date, renew is provisioned, auto create renew invoice, in trial, trial end date, product code 1, product code 2, main contracts product ID, product ID, provision configuration ID, external ID) - Status (created at, updated at, deleted at) - Amounts (net product discount amount, net global discount amount, net amount, tax amount, total amount) |
| Staff Export Only | Export of staff user data. | - Staff details (ID, firstname, lastname, email, admin) - Status (created at, updated at, deleted at) |
| Tickets Export Only | Export of support tickets. | - Ticket details (ID, message ID, reference, department, status code, client ID, lead ID, user ID, source type) - Status (created at, updated at, deleted at) |
| All Invoices GST Export Only | GST-specific invoice report. | - Invoice details (number, client, state, status, create datetime, paid datetime) - GST details (GSTIN, subtotal, total) |
| Invoice Items Taxes Detailed Export Only | Detailed tax breakdown per invoice item. | - Invoice details (date, number, invoice, status, invoice category) - Tax details (tax country, invoice tax amount, tax tag, tax, invoice tax amount formatted) |
| Tags | Summary and listing of tags used in client and invoice management. | - Tag details (ID, name, description) |
| Clients Tags Export Only | Export of tags linked to clients. | - Client details (client ID, tag ID, tag) |
| Cancellation Requests Export Only | Export of client cancellation requests. | - Client details (ID, contract ID, contract product ID) - Status (created at, updated at) |
| Clients Wallet Balances Export Only | Export of client wallet balance details. | - Client details (client ID) - Balance details (balance brand currency, balance client currency, client currency code, enable negative wallet balance) |
| Scheduled Actions Export Only | Export of scheduled automation actions. | - Automation details (id, contract id, contract product id, user id, original values, values, action) - Status (created at, updated at, executed at, deleted at) |
| All Taxes Export Only | Summary of all taxes applied across invoices. | - Invoice details (number, invoice category, invoice id, invoice product id, contract product id, create datetime, product, currency exchange rate, currency, country name, region name, city name, postcode, county, company name) - Tax details (tax number, tax percentage) - Amounts (tax amount brand currency, tax amount document currency, invoice product net amount, invoice product tax amount, invoice product total amount document currency, invoice product net amount document currency, invoice product tax amount document currency, invoice product total amount) |
| Clients Custom Field Values Export Only | Export of client-specific custom field data. | - Field details (ID, field ID, field name, client ID, value) - Status (created at, updated at) |
| Objects Tags Export Only | Export of tags applied to various objects within the system. | - Object details (ID, object type, object ID, tag ID, tag name) - Status (created at, updated at, deleted at) |